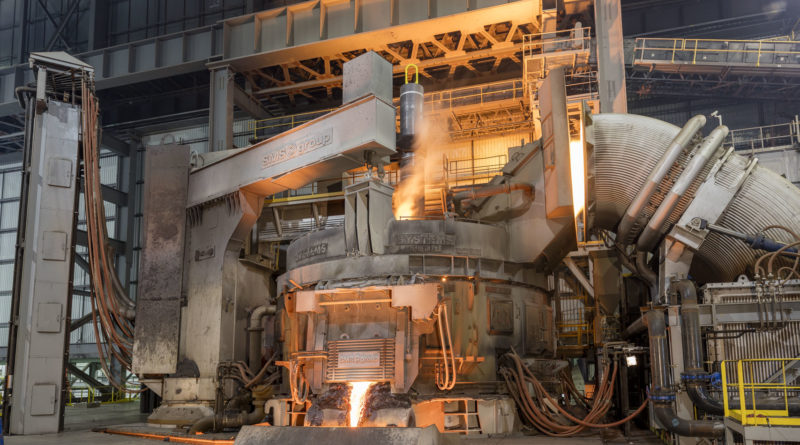
Crude steel production by process 2023
| Million tonnes | Oxygen % | Electric % | Other % | Total % | |
| Austria | 7.1 | 90.7 | 9.3 | – | 100.0 |
| Belgium e | 5.9 | 69.3 | 30.7 | – | 100.0 |
| Bulgaria | 0.5 | – | 100.0 | – | 100.0 |
| Croatia | 0.2 | – | 100.0 | – | 100.0 |
| Czechia | 3.4 | 95.6 | 4.4 | – | 100.0 |
| Finland | 3.8 | 62.0 | 38.0 | – | 100.0 |
| France | 10.0 | 59.2 | 40.8 | – | 100.0 |
| Germany | 35.4 | 72.3 | 27.7 | – | 100.0 |
| Greece | 1.2 | – | 100.0 | – | 100.0 |
| Hungary | 0.5 | 52.3 | 47.7 | – | 100.0 |
| Italy e | 21.1 | 14.2 | 85.8 | – | 100.0 |
| Luxembourg | 1.9 | – | 100.0 | – | 100.0 |
| Netherlands | 4.7 | 100.0 | – | – | 100.0 |
| Poland | 6.4 | 48.8 | 51.2 | – | 100.0 |
| Portugal | 2.0 | – | 100.0 | – | 100.0 |
| Romania e | 1.6 | 53.2 | 46.8 | – | 100.0 |
| Slovakia e | 4.4 | 90.0 | 10.0 | – | 100.0 |
| Slovenia | 0.5 | – | 100.0 | – | 100.0 |
| Spain | 11.4 | 28.1 | 71.9 | – | 100.0 |
| Sweden | 4.3 | 68.6 | 31.4 | – | 100.0 |
| European Union (27) | 126.3 | 55.2 | 44.8 | – | 100.0 |
| Türkiye | 33.7 | 28.4 | 71.6 | – | 100.0 |
| United Kingdom | 5.6 | 79.6 | 20.4 | – | 100.0 |
| Others e | 4.3 | 41.0 | 59.0 | – | 100.0 |
| Other Europe | 43.6 | 36.2 | 63.8 | – | 100.0 |
| Russia e | 76.0 | 65.1 | 32.0 | 2.9 | 100.0 |
| Ukraine | 6.2 | 48.1 | 12.3 | 39.6 | 100.0 |
| Other CIS e | 8.2 | 46.9 | 51.6 | 1.6 | 100.0 |
| Russia & Other CIS + Ukraine | 90.5 | 62.2 | 32.4 | 5.3 | 100.0 |
| Canada | 12.2 | 58.2 | 41.8 | – | 100.0 |
| Mexico | 16.2 | 6.6 | 93.4 | – | 100.0 |
| United States e | 81.4 | 31.7 | 68.3 | – | 100.0 |
| Other North America e | 0.5 | – | 100.0 | – | 100.0 |
| North America | 110.2 | 30.8 | 69.2 | – | 100.0 |
| Argentina | 4.9 | 42.9 | 57.1 | – | 100.0 |
| Brazil | 31.8 | 76.2 | 22.5 | 1.3 | 100.0 |
| Chile | 1.2 | 61.5 | 38.5 | – | 100.0 |
| Venezuela | 0.0 | – | 100.0 | – | 100.0 |
| Other South America e | 3.6 | 6.8 | 93.2 | – | 100.0 |
| South America | 41.6 | 65.7 | 33.3 | 1.0 | 100.0 |
| Egypt | 10.4 | – | 100.0 | – | 100.0 |
| South Africa e | 4.9 | 56.8 | 43.2 | – | 100.0 |
| Other Africa e | 9.0 | 4.4 | 95.5 | 0.1 | 100.0 |
| Africa | 24.2 | 13.1 | 86.9 | 0.0 | 100.0 |
| Iran e | 31.0 | 7.9 | 92.1 | – | 100.0 |
| Saudi Arabia | 9.9 | – | 100.0 | – | 100.0 |
| Other Middle East e | 13.5 | – | 100.0 | – | 100.0 |
| Middle East | 54.5 | 4.5 | 95.5 | – | 100.0 |
| China e | 1 019.1 | 90.1 | 9.9 | – | 100.0 |
| India | 140.8 | 43.6 | 56.4 | – | 100.0 |
| Japan | 87.0 | 73.8 | 26.2 | – | 100.0 |
| South Korea | 66.7 | 70.5 | 29.5 | – | 100.0 |
| Taiwan, China | 19.1 | 59.2 | 40.8 | – | 100.0 |
| Other Asia e | 62.6 | 48.8 | 51.2 | – | 100.0 |
| Asia | 1 395.2 | 81.2 | 18.8 | – | 100.0 |
| Australia | 5.5 | 73.2 | 26.8 | – | 100.0 |
| New Zealand | 0.6 | 100.0 | – | – | 100.0 |
| Total of above countries | 1 892.2 | 71.1 | 28.6 | 0.3 | 100.0 |
The countries in this table accounted for approximately 100% of world crude steel production in 2023.
e – estimate


