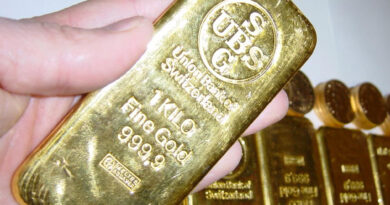
Has the momentum carried gold too far?
Since the market turbulence ended in March, the gold price has been making new highs and breached $2,000/oz. However, other safe havens have not moved as far. The 10-year US Treasury yield has only just moved to a new low and the yen has not strengthened beyond its level in March.
According to the Heraeus Precious Appraisal report, the economic recovery that has taken place following the easing of lockdowns is not enough to justify the current level of stock markets in the US or Germany. Another bout of market volatility could see gold sell off again, as happened in March.
The dollar has been weakening against the euro for some time and this has helped gold’s rise. However, speculative futures contracts long the euro, and therefore short the dollar, have just reached a record level. Previous extremes have occurred around turning points. This suggests that the dollar’s weakness could soon reverse and that would be a headwind for gold
The European Central Bank has been matching the Fed euro for dollar in expanding its balance sheet, with both now over $7 trillion. When gold reached its previous record high in 2011, the Fed was in the middle of QE2 (Quantitative Easing 2), having expanded its balance sheet from $900 billion in 2008 to $2.9 trillion in 2011. Meanwhile, the Eurozone was dealing with the Greek debt crisis. However, inflation has not increased. US core CPI (excluding changes in energy and food prices) has been less than 2.5% since 2008, as has the EU’s Harmonised Index of Consumer Prices (HICP). Inflation is showing up in financial asset prices, not CPI.
Bond yields near historical lows demonstrate more concern about deflation than fear of inflation. Real interest rates are negative which tends to boost gold. However, the Fed has said it will not move to negative interest rates, and should inflation turn into deflation then the real interest rate will rise which would also be a headwind for gold. Buying gold at these levels offers much less of a margin of safety.
Total gold supply declined by 2% in the first half of 2020 to 2,192 t. Mine production slipped 5% to 1,604 t (the lowest half-year level since 2014), and recycling dropped by a similar amount (source: World Gold Council). The global impact of Covid-19 was most significant in Q2, with some key gold-producing nations such as Mexico, Peru and South Africa badly affected by national lockdowns.
Supply from China, the largest producer, fell 12% year-on-year in Q1 but was recovering by Q2. Remarkably, Russian supply increased 15% year-on-year as production stabilised at new projects, and operations were largely unaffected by the effects of Covid-19. Despite lockdowns now easing around the world, the disruption seen in H1 is likely to have a lasting impact on supply this year.
The gold price pushed through $2,000/oz two weeks ago, as it continues to be supported by low interest rates and a weakening US dollar. The price has rallied 35% in the year to date, including 11% in July alone. Such a steep rally suggests a downward correction in the near term is likely (if only partially).


